
If you’re running an ecommerce store on Shopify, you’ll have access to built-in reports. These reports can help you make smarter decisions, streamline how you run your business, and understand your customers’ behaviour.
In this guide, we’ll break down what these reports are, what types are available depending on your plan, how to get the most out of them and some of the pitfalls.
Shopify reports turn your store’s data into clear, visual summaries to show you metrics and trends including your top-performing products, your busiest sales periods, and where your site traffic is coming from.
These insights can help you cut unnecessary costs and increase your conversion rates by guiding everything from product development to marketing and sales strategy.
Your access to the report depends on your Shopify plan.
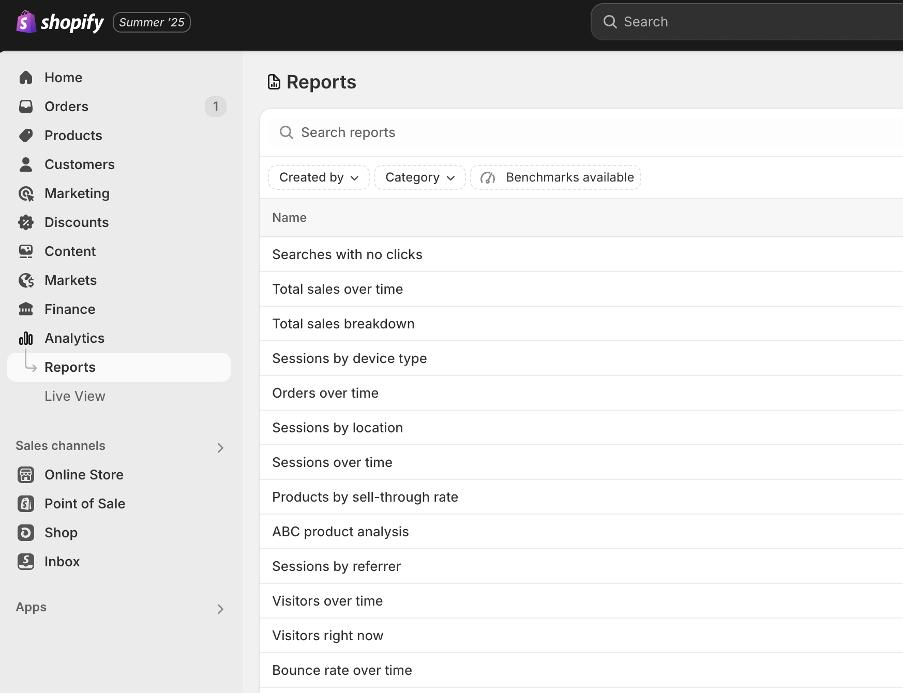
You’ll find all your reports in the Analytics section of your Shopify dashboard, under the tab called ‘Reports’.
Depending on your plan, here’s a breakdown of the kinds of reports you can access:
A snapshot summary of your main metrics. This can be customized. Available on all plans, including Lite and Basic.
Track overall business health: sales, taxes, tips, payments, and more. Key metrics include total sales and net sales.
Included across all plans. Offers insights on how each product performs over time.
Available from the Basic plan and up. See who’s currently browsing your store in real time.
From Basic upwards. Helps you understand your website traffic, e.g. how often visitors come back, where they’re from, and how they found you.
Examples:
Available on Shopify, Advanced, and Plus plans. Helps track which products are flying off the shelves and which are just sitting.
Examples:
From Basic plan upwards. Focuses on how people interact with your store and where they drop off. This is great for improving conversions.
Examples:
Available on Basic and higher, but with more detail as you go up. Helps measure how your marketing campaigns are performing and what’s converting.
Examples:
Available on the Shopify, Advanced, and Plus plans. Tracks order volume, shipping, fulfilment, and returns.
Also for Shopify and up. This allows you to understand what’s driving your revenue: where it’s coming from, customer behaviour, and what’s guiding profit.
Examples:
Available on Shopify, Advanced, and Plus. These show you how your business is doing offline. However, this report is only available if you activated a Point of Sale as a sales channel on your store.
Available on higher-tier plans. Helps you calculate profit margins and performance per product or location.
Examples:
Helps you understand who’s buying and how often.
Examples:
Advanced and Plus users also get access to At-risk and Loyal Customer reports.
They allow you to (within certain constraints) customize your reports.
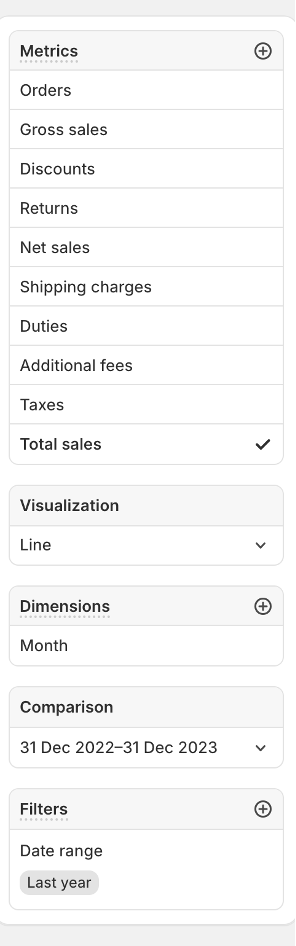
Custom reports are available on the Advanced and Shopify Plus plans. Shopify’s default reports can be customised to show the data you care about. You can filter results, adjust columns, and choose specific time ranges using your Shopify data. Once you’ve tailored a report using these options, you can save it as a custom report. Alternatively, you can start from scratch by creating a custom report from a blank exploration view. For example, let’s run through how to customize the ‘Total Sales Over Time’ report to suit your needs.
These same steps can be used to tailor other reports to your needs.
This image shows the options available on the side panel in order to customize your ‘Total Sales over Time’ report:
To export a Shopify report, go to the Analytics section in your dashboard. Once you’re in a report, look for the Export button in the top right corner. Click it to download a file version, which often includes more detailed data than what’s shown on screen.
On Shopify, Click Rate (CR) and Click-Through Rate (CTR) are two different ways to measure how people interact with your emails.
CTR is more precise since it looks only at people who opened the email, while CR gives a broader view of click activity across your entire email list.
Shopify’s built-in reporting tools provide a solid foundation to understand your business performance and make informed decisions. However, many users find these reports either too rigid or overly complex, and they only show your eCommerce data in isolation.
Most marketing and trading teams need a more complete view, combining Shopify data with other marketing channels and platforms, to get a true, holistic picture of their performance.
If your reporting needs go beyond what Shopify offers, ASK BOSCO®’s Shopify connector can automate and simplify your data analysis, bringing all your key metrics together in one place. This way, you get fast, actionable insights across your entire marketing and ecommerce ecosystem, right at your fingertips. For more insights and tailored strategies for your Shopify reporting, please get in contact with our team, at ASK BOSCO®, or you can email our team, team@askbosco.com.