TLDR: A data and analytics maturity model maps how an organization moves from simply reporting on what happened to actually predicting and eventually shaping what happens next. Most frameworks describe four stages (descriptive, diagnostic, predictive, and prescriptive analytics), with difficulty and value both increasing as you move up the curve.
What is a data and analytics maturity model?
A data and analytics maturity model is a framework for understanding how sophisticated an organization’s use of data actually is, from basic reporting all the way through to using data to actively shape decisions before they happen.
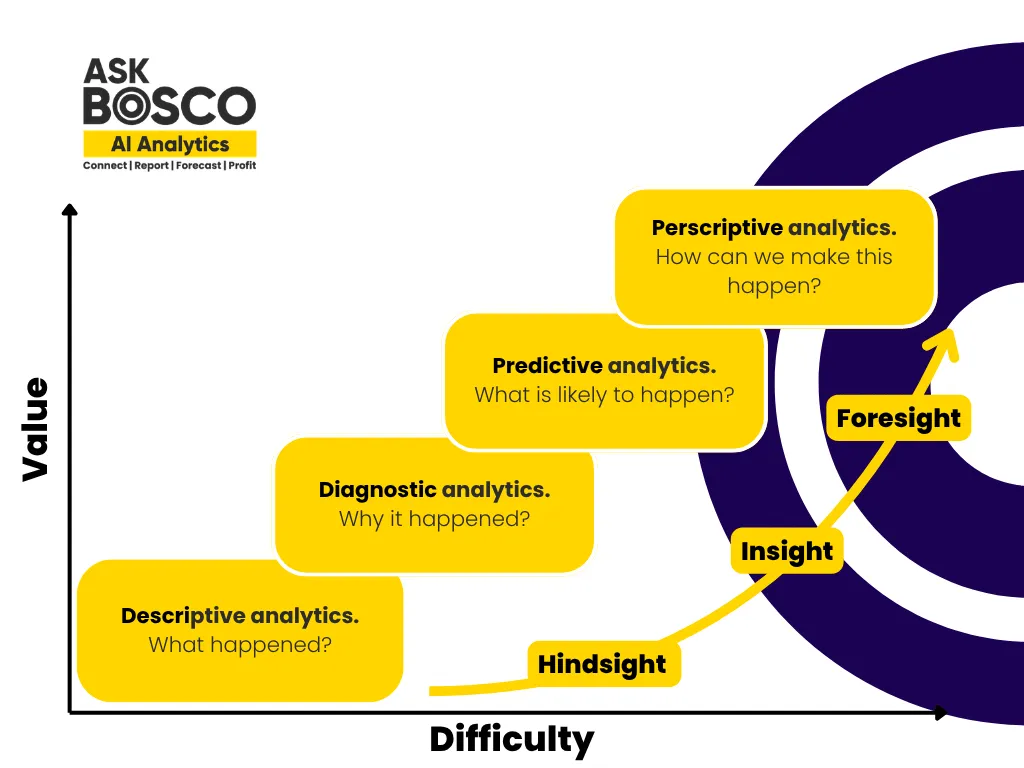
The clearest way to picture it is as a curve. On one axis, you have difficulty. On the other, you have value. As you move along the curve, you progress through four connected stages, each one asking a different question:
- Descriptive analytics – What happened?
- Diagnostic analytics – Why did it happen?
- Predictive analytics – What is likely to happen?
- Prescriptive analytics – How can we make it happen?
The stages build on each other in a curve: hindsight (understanding the past) leads to insight (understanding the “why”), which leads to foresight (understanding what’s coming next). Each step upcosts more effort and more sophisticated technique, but each step also unlocks more value.
For a marketing team, that progression is easy to picture. Descriptive analytics is spend, clicks, and impressions from a Google Ads campaign, for instance, what happened. Diagnostic analytics is digging into whether a sale event or business change explains a spike in performance, why it happened. Predictive analytics uses historical data to forecast what’s likely to happen next, similar in spirit to A/B testing or incrementality testing. And prescriptive analytics, the hardest stage to reach, is where a tool like a budget optimizer comes in: if we spend X, what’s the likelihood of Y happening, and what should we actually do about it?
The 5 stages of analytics maturity
Most traditional maturity models describe four core stages. As AI becomes more embedded in analytics platforms, though, many frameworks now add a fifth: cognitive analytics, where the system doesn’t just recommend an action but starts to learn, adapt, and act with increasing autonomy over time.
Here’s how all five stages map out in practice:
Descriptive analytics (what happened?)
– The easiest stage to reach. Tools like Google Ads and Google Analytics report on spend, clicks, impressions, and sales. Data is easy to get hold of and report on.
Diagnostic analytics (why did it happen?)
This is where things start taking more time and technique. Diagnostic analytics means matching data from multiple sources. For example, you might realize that a high bounce rate in Google Analytics, not the ad itself, explains why a Google Ads campaign isn’t converting. KPIs make this stage much faster. We calculate KPIs such as ROAS, cost per acquisition, and conversion rate from core metrics like spend, clicks, conversions, and revenue. Reviewing the KPI first shows you straight away which campaigns are underperforming and need a closer look, and which are performing well enough to showcase. You can then dig into the core metrics behind it to find the cause, instead of starting from scratch every time.
Predictive analytics (what is likely to happen?)
Requires more data, a longer time period, and more statistical technique. Historical data is used to build a forecast; that forecast becomes the benchmark you test against once a campaign goes live.
Prescriptive analytics (how can we make it happen?)
The most difficult and valuable stage. This is forecasting at scale, tools like a budget optimizer that model the likely outcome of a given spend level, so teams can make the change that gets them there.
Cognitive analytics (what should the system do next?)
An emerging fifth stage where AI increasingly closes the loop itself: flagging what’s happened, grading how severe it is, and prompting, or eventually taking, the next action automatically.
That last stage is already starting to show up in day-to-day marketing tools. AI-driven alerts that flag a 10% traffic drop as “something to watch” versus an 80% drop as a “red alert requiring immediate action” are an early, practical example of cognitive analytics in action, turning a raw data point into a graded, actionable response.
The Gartner analytics maturity model
Gartner has its own well-known framing of the analytics maturity curve. The core stages are broadly the same, descriptive, diagnostic, predictive, and prescriptive, but Gartner’s version is typically delivered as a consultancy-style engagement, complete with a maturity score and peer benchmarking, so an organization can see exactly where it sits against others in its sector.
Where Gartner’s model differs most is in how granular it gets. Rather than describing four broad stages, it breaks the journey down into detailed modules, starting with designing the overall data strategy, then defining the data models an organization wants to use, before determining where any given tool or feature actually sits on the maturity curve. Not every capability needs to sit at the prescriptive end, different tools and features can, and often should, sit at different points along the curve depending on what they’re built to do.
The Davenport analytics maturity model
Tom Davenport’s well-known analytics maturity framework takes a slightly different angle. Rather than mapping stages of analysis, it classifies organizations themselves, on a spectrum running from “analytically impaired” through to full “analytical competitors.”
It’s a useful companion to the Gartner and descriptive/diagnostic/predictive/prescriptive models because it shifts the focus from what your tools can do to how mature your organization is as a whole at using data to compete. An analytically impaired organization might have data but rarely act on it strategically; an analytical competitor builds its entire strategy around data-driven decision-making.
Analytics maturity models across different functions
Analytics maturity doesn’t look the same in every function and marketing and SEO are a good example of just how differently the same four stages can play out.
Marketing (paid media)
This tends to move through the curve in a fairly linear, campaign-led way. Descriptive analytics comes from platforms like Google Ads. Diagnostic analytics means matching that data against Google Analytics to explain a performance shift. Predictive analytics builds on a track record, a paid media team might know, based on past results, that expanding into shopping and display campaigns after starting with brand will reliably build traffic. That’s predictive thinking, even without running a full statistical forecast.
SEO
This works differently. SEO teams draw on tools like Google Search Console and Google Analytics for descriptive reporting, and platforms like Semrush and Ahrefs to track ranking position against competitors for diagnostic work. For example, they might identify that a specific keyword’s ranking drop from position 8 to position 13 explains a wider traffic dip.
Where SEO genuinely struggles is at the predictive stage. Google’s algorithm changes multiple times a year now, far more often than it once did, which makes forecasting what will happen to a site much harder to do with data alone. As a result, SEO teams tend to lean more on experience and instinct, with more outreach, more content, and more link building, and they stay more reactive to external factors than paid media teams typically need to be.
Generative engine optimization (GEO) is a clear example. As more customers ask ChatGPT, Google AI Overviews, Perplexity, and Claude for recommendations, visibility no longer depends only on where a page ranks. SEO teams can’t control how these AI models choose which brands to recommend, so they’re adapting by building authority across the third-party sources AI answers draw on, such as reviews, directories, publications, and community sites like Reddit. They’re also having to source new data to monitor it, tracking how often their brand appears in AI answers and which sources influence those answers, because traditional tools like Google Search Console don’t capture this.
The takeaway: a maturity model isn’t a single ladder every function climbs at the same pace. Each discipline hits its own points of difficulty, and a genuinely mature organization understands where each function realistically sits, rather than expecting every team to be equally predictive or prescriptive.
How to assess and improve your analytics maturity
Improving analytics maturity isn’t just about buying a new tool, it starts with the underlying structure of your data itself.
If you’re assessing your own analytics maturity, the same principle applies. Before investing further up the curve, into predictive models or prescriptive tools, it’s worth asking whether your underlying data structure can actually support that ambition, or whether it needs rebuilding first.
How ASK BOSCO® helps marketing teams move up the maturity curve
Most marketing teams get stuck at the descriptive and diagnostic stages, reporting on what happened and digging into why, without the time, tooling, or statistical horsepower to reliably predict what’s likely to happen next, let alone prescribe what to do about it.
That’s exactly the gap ASK BOSCO® is built to close. By connecting fragmented marketing and ecommerce data into a single source of truth, ASK BOSCO® takes the manual matching and exporting out of the descriptive and diagnostic stages, and uses that same connected data to forecast future performance, moving teams into predictive territory without needing an in-house data science function.
Every part of the platform maps back to the same four pillars, Connect, Report, Forecast, Profit, mirroring the maturity curve itself: connect and report cover the “what happened” and “why,” while forecasting is what pushes a marketing team from insight into real foresight.
Wherever your team currently sits on the maturity curve, the next step up starts with the same question: is your data structured well enough to support it? If you want help finding out, get in touch at team@askbosco.io.