We’re excited to announce the launch of our new ecommerce reporting feature within the ASK BOSCO® AI marketing platform! This powerful feature provides you with comprehensive insights into your ecommerce performance through three distinct reports: the Weekly Overview, the Product Report, and the Geolocation Report. Whether you’re tracking sales trends, analyzing product performance, or understanding customer locations from Shopify, your website or any other ecomm platform, these reports provide the detailed insights you need.
Weekly Overview Report
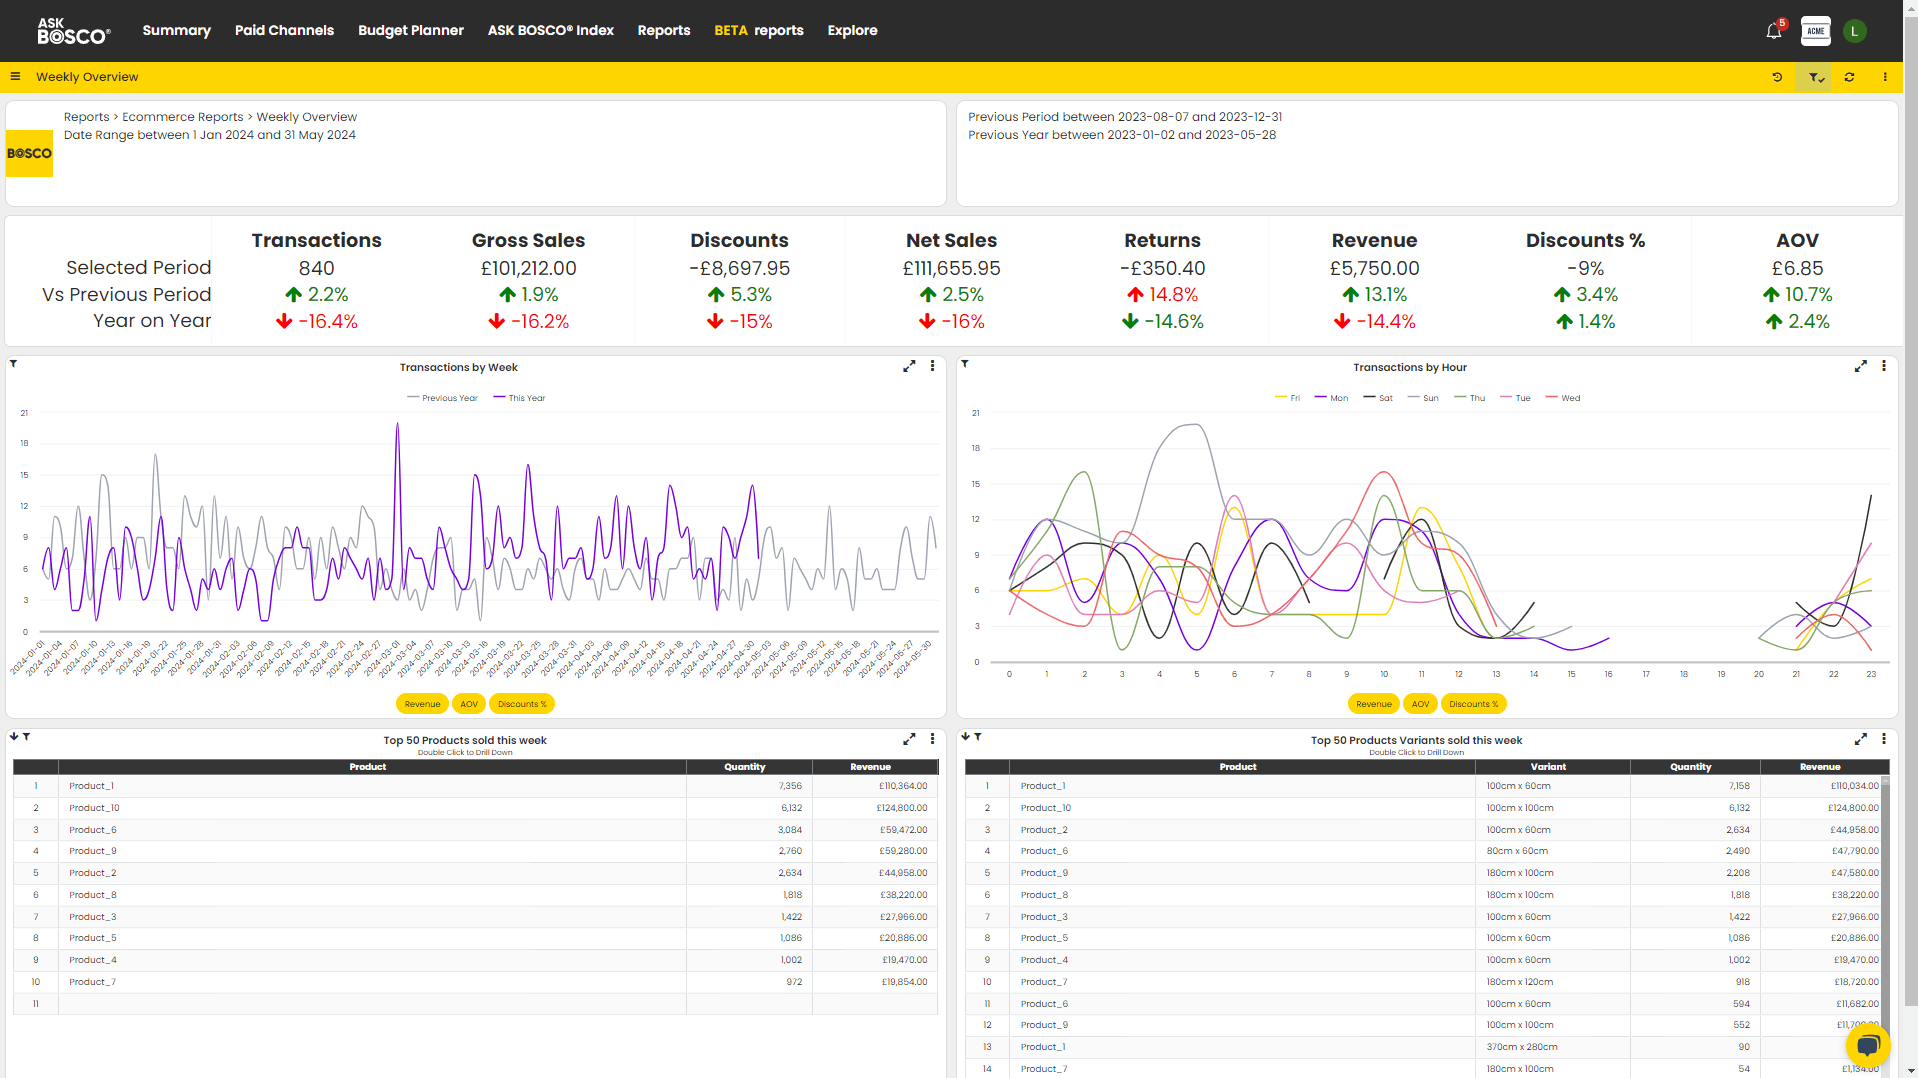
The Weekly Overview report offers a snapshot of your key metrics and product performance over a specific period. Here’s what you can expect:
- Headline Numbers: At the top, you’ll find crucial figures such as gross sales and net sales, which are compared to both the previous period and the same period last year. This allows you to track growth and identify trends over time.
- Charts: We’ve included a by-week chart and a by-hour chart. The by-week chart showcases transactions, revenue, average order value (AOV), and discounts, all compared to the previous period. Similarly, the by-hour chart allows you to select a specific day of the week (e.g., Friday) and see these metrics broken down by hour.
- Tables: Detailed tables display the top 50 products and the top 50 product variants, ranked by revenue. Each entry shows the quantity sold, product name, and revenue generated. You can also drill down into these tables; for instance, double-clicking on a product will reveal its quantity and price over your selected time period.
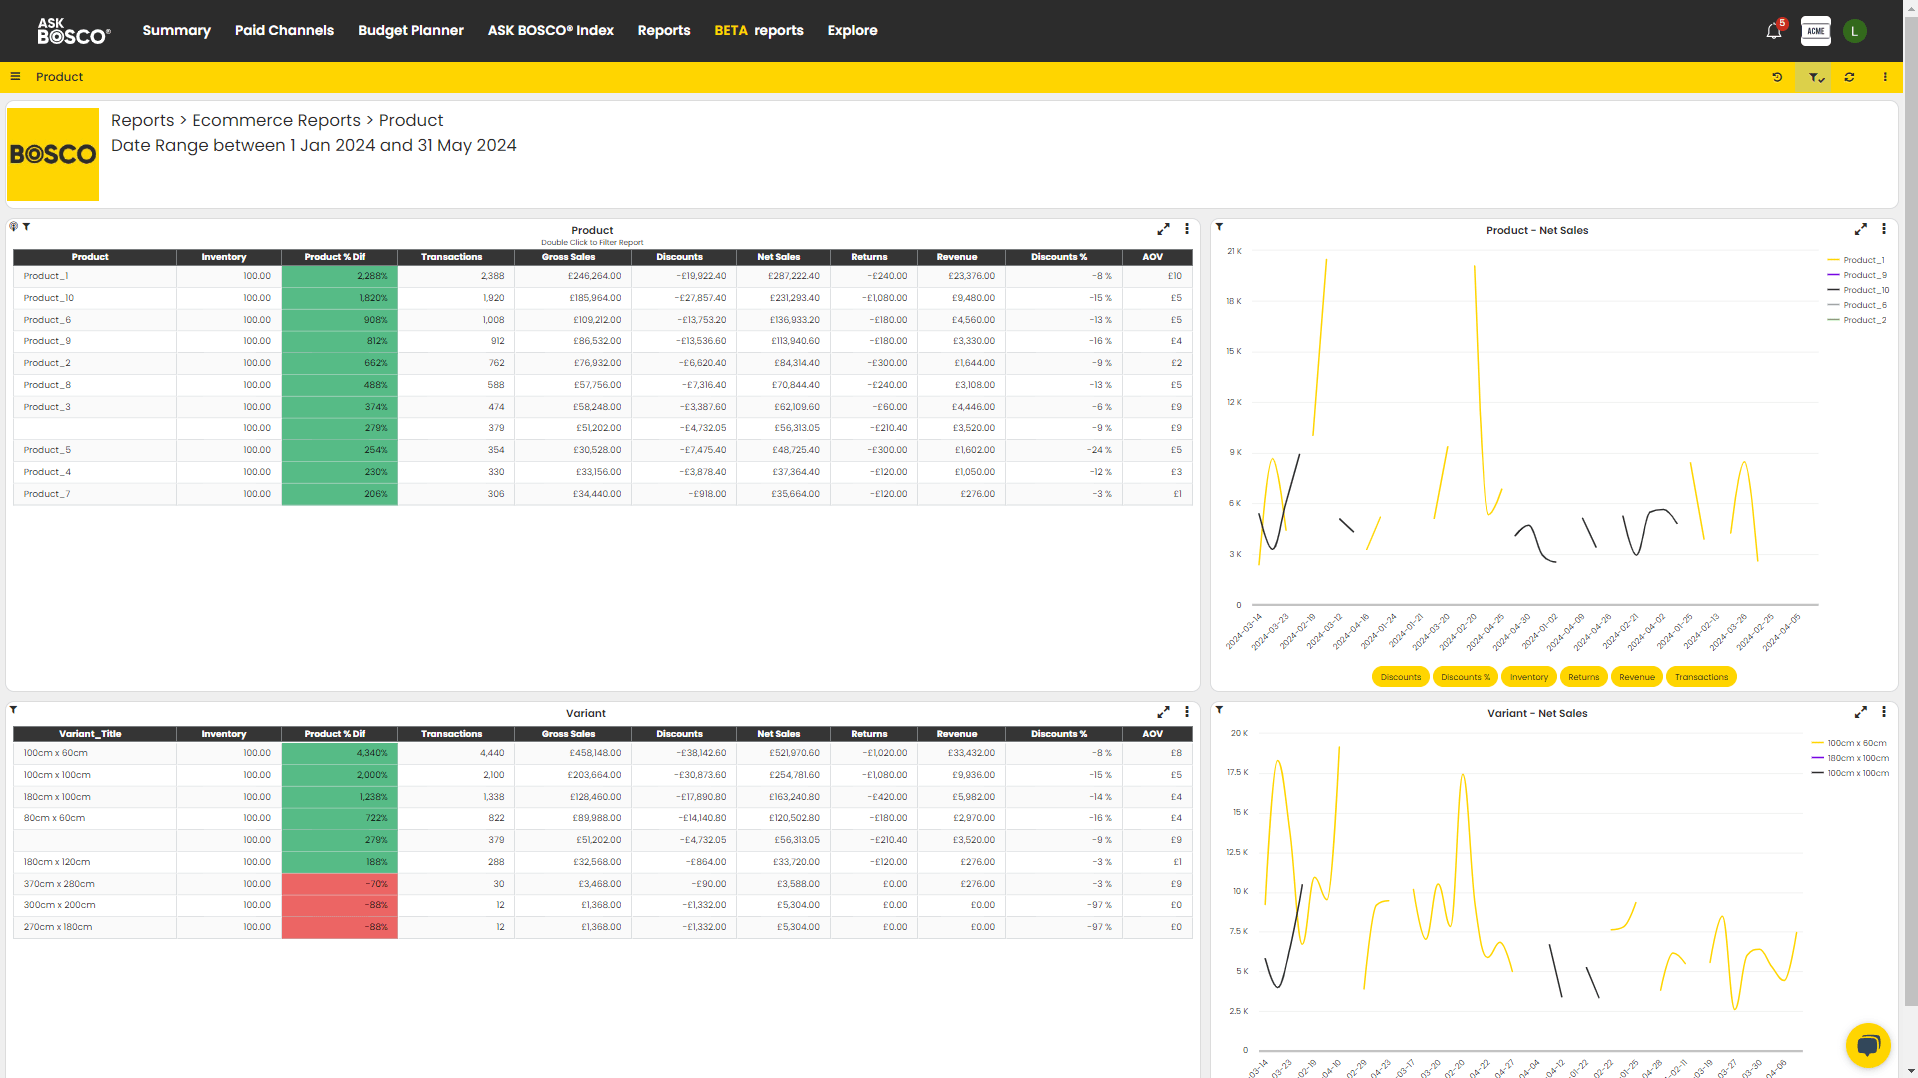
Product Report
The Product Report provides an in-depth analysis of your products and their variants. This report helps you understand product-specific performance metrics:
- Product and Variants Table: The first table lists all your products, their inventory levels, and a product percentage difference metric, which is calculated by comparing inventory against transactions. Additional key metrics are also included.
- Variant Details: Similar metrics are available for product variants in a separate table below. You can filter this report by double-clicking on a specific product to view its detailed metrics.
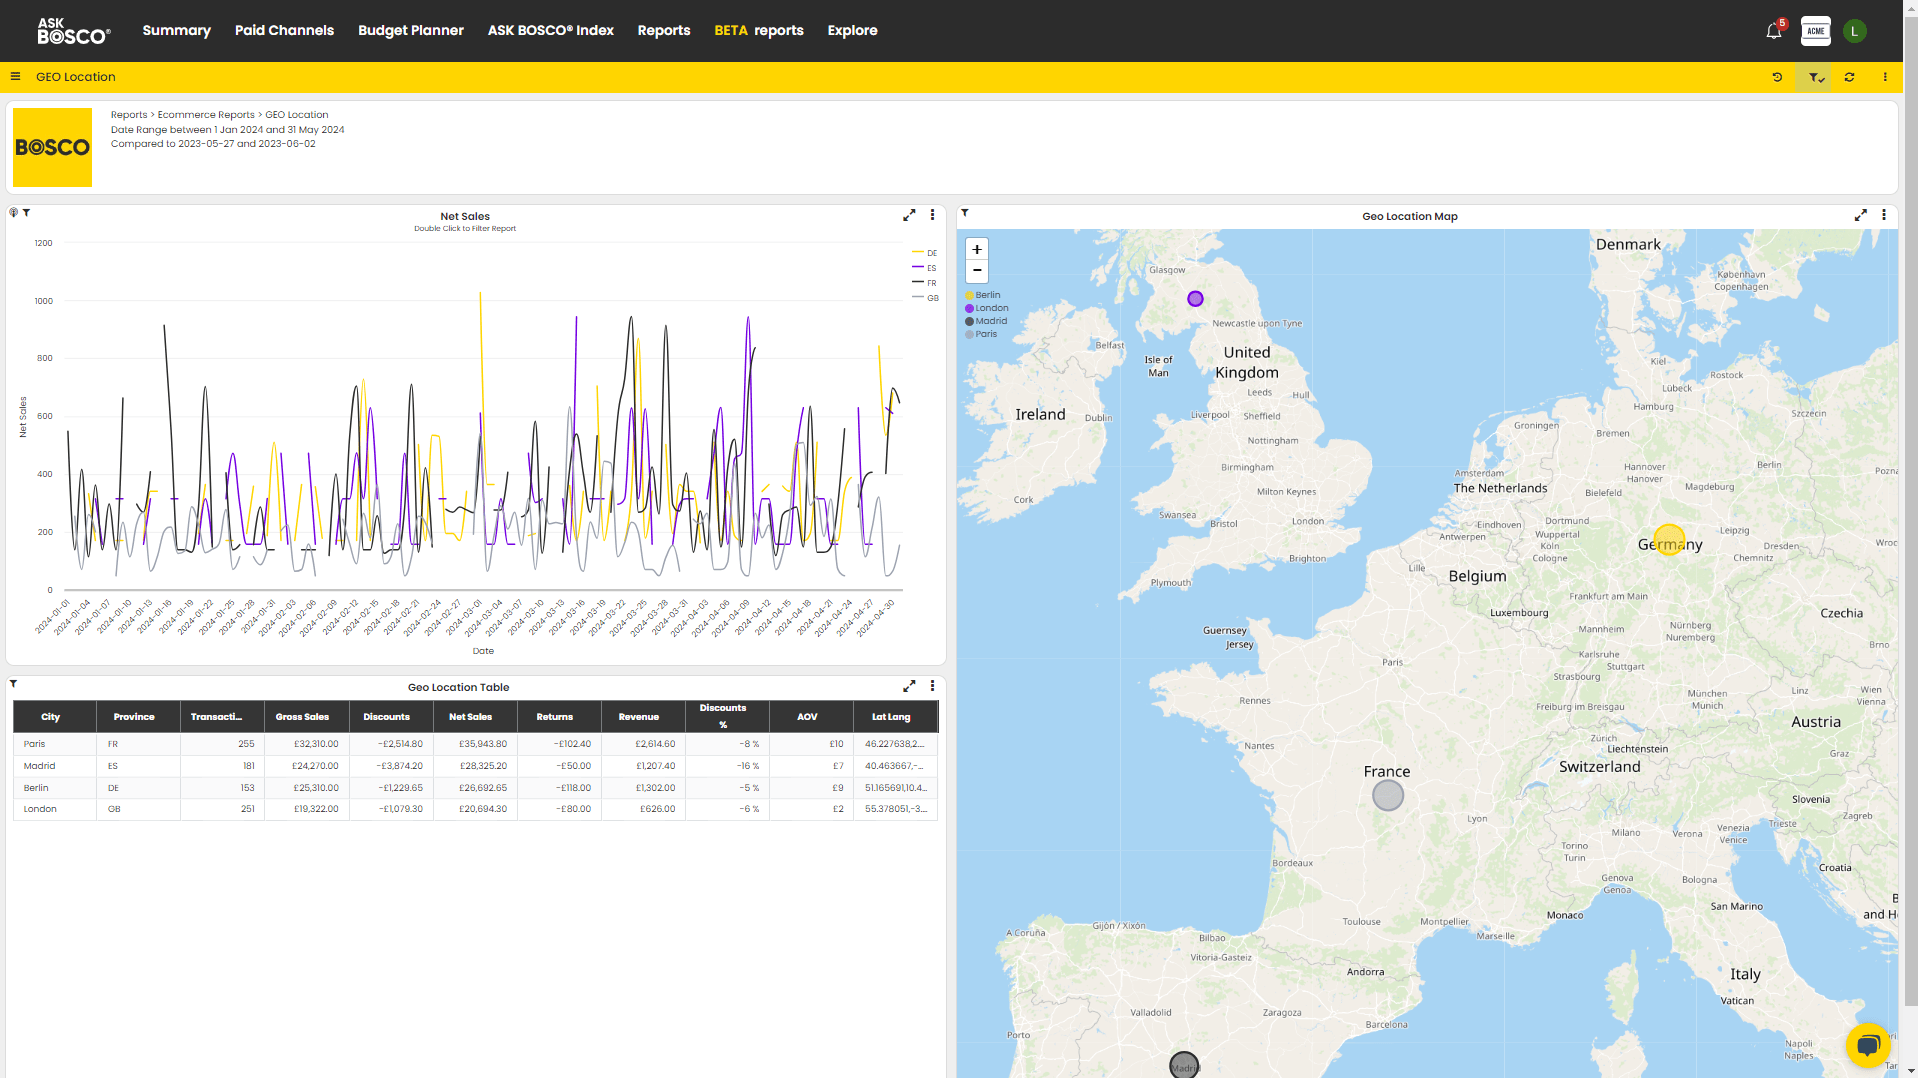
Geolocation Report
Understanding where your customers are located is crucial for targeted marketing. The Geolocation Report helps you visualize and analyze customer distribution:
- Interactive Map: This map shows the locations of your customers in different countries such as the UK, France, Germany, and Spain. You can zoom in and out to get a closer look at specific areas.
- Geolocation Table: This table provides detailed metrics for each country, allowing you to compare performance across different regions.
- Net Sales Graph: A net sales graph offers a detailed view of sales performance by location. You can also double-click on any part of this graph to filter the entire report based on that specific data point.
Key benefits of the ASK BOSCO® Ecommerce Reporting feature:
1. Centralized Performance Tracking: Access key metrics of website performance from various data sources consolidated into a single dashboard, streamlining monitoring and analysis processes.
2. Comprehensive Website Performance Insights: Gain insights into sales, revenue, and other crucial ecommerce metrics directly from your ecommerce platform, whether that be Shopify, your website or elsewhere, providing a holistic view of website performance.
3. Product Performance Analysis: Identify top-selling and underperforming products, enabling informed decision-making regarding inventory management, marketing strategies, and product development.
4. Customer Insights: Understand customer behaviour and sales sources, facilitating targeted marketing campaigns and customer relationship management initiatives to enhance sales and customer satisfaction. Also analyze such as discounts, delivery options, and product bundles to optimize your pricing strategies, enhance product offerings, and improve overall the user experience on your website.
If you’d like to find out more about this feature or any part of the ASK BOSCO® AI Reporting, Benchmarking & Forecasting Platform, please get in touch with us at team@askbosco.io